The ETF vs. Mutual Fund Duel: Minimising Expense Ratios for Maximum Growth
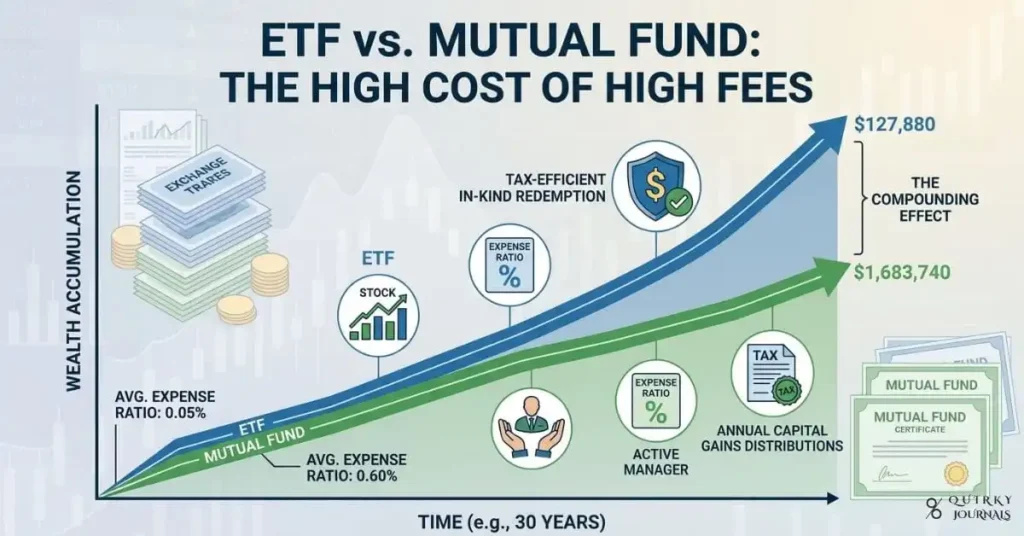
Two investors put $100,000 into the stock market on the same day. They choose funds tracking the same index. Twenty years later, one has significantly more money than the other. The difference? Not luck, not timing, not skill. It is fees. Specifically, it is the expense ratio, that quiet percentage that bleeds from your portfolio every single year, compounding in reverse while your wealth tries to grow forward.
This is the central drama of the ETF versus mutual fund debate. Both vehicles pool investor capital into diversified baskets of securities. Both can track the same underlying index. Yet they differ enormously in cost, tax treatment, trading mechanics, and the total wealth they ultimately deliver to long-term investors. Understanding those differences is not a minor technical detail. It is one of the most consequential decisions any individual investor can make.
This post breaks down everything you need to know about exchange-traded funds (ETFs) versus mutual funds, with a particular focus on expense ratios, tax efficiency, and long-term compounding. We will move from the basics through to nuanced comparisons that most financial articles gloss over, including the structural reasons ETFs pay fewer capital gains, the scenarios where mutual funds still win, and how to apply all of this to your actual portfolio today.
What Is an Expense Ratio and Why Does It Matter So Much?
The expense ratio is the annual fee that a fund charges its shareholders, expressed as a percentage of average net assets. A fund with a 0.50% expense ratio takes 50 cents from every $100 you have invested, every year, regardless of whether the fund goes up or down. It is deducted automatically from fund assets before any returns are reported, which means most investors never see it as a line item on their statements.
That invisibility is part of why expense ratios are so dangerous. Because the fee is deducted before returns are reported, investors tend to underestimate its cumulative impact. A fund that returns 8% gross with a 1% expense ratio delivers 7% to you. Another fund returning 8% gross with a 0.05% expense ratio delivers 7.95% to you. That 0.95 percentage point gap sounds trivial. Over 30 years on a $100,000 starting balance, it is not trivial at all.
According to analysis from TradeThatSwing, even a 0.3 percentage point difference in expense ratio can cost more than $78,000 over 30 years on a $100,000 initial investment. A 1 percentage point difference on a $100,000 initial investment costs roughly $100,000 or more in foregone growth over a three-decade horizon. Essentially, one investor hands the fund company a sum larger than their entire original investment, in exchange for nothing but keeping their money in a more expensive fund.
ETF Fees vs. Mutual Fund Fees: The Baseline Numbers
The headline difference in costs between ETFs and mutual funds is significant and well-documented. According to State Street Global Advisors, the median expense ratio for index ETFs is typically lower than that of index mutual funds. ETFs historically average around 0.56% while mutual funds average around 0.90%. For the broadest passive index products, however, the gap becomes even more dramatic.
Data from Western Southern Financial Group, citing Morningstar’s 2024 data, shows the current expense ratio landscape as follows. The asset-weighted average for all passive funds sits at 0.11%. For all active funds, it sits at 0.59%. Index equity ETFs average 0.14%. Active equity mutual funds average 0.60%. Broad market index ETFs, those tracking the S&P 500 or total market, often charge less than 0.05%. Some providers, most notably Fidelity with certain zero-fee index funds, have pushed core index fund expenses to essentially zero.
These numbers matter because they represent the realistic cost landscape for investors today. The old days of paying 1.5% or more for a large-cap mutual fund are not entirely gone, but fee compression has been dramatic. However, the difference between paying 0.60% and paying 0.05% remains enormous when compounded over a working lifetime of saving and investing.
The Hidden Costs Beyond the Expense Ratio
Focusing purely on the stated expense ratio can be misleading for both ETFs and mutual funds. Each vehicle carries additional costs that do not appear in the headline figure and can significantly affect total returns.
For mutual funds, the additional costs investors must watch for include sales loads, 12b-1 fees, and redemption fees. Investopedia explains that the expense ratio reported in a mutual fund prospectus includes management fees, general operating expenses, and 12b-1 fees. Sales loads, which are front-end or back-end charges for buying or selling the fund, are separate and can add 1% to 5.75% or more to the true cost of ownership. No-load funds eliminate sales charges, but 12b-1 fees of up to 1% per year can still apply. These are annual marketing and distribution fees that the fund uses to compensate brokers for selling its shares.
For ETFs, the additional costs are different in nature. Charles Schwab highlights bid-ask spreads as the primary implicit cost of ETF ownership. The bid-ask spread is the difference between the price at which you can buy an ETF and the price at which you can sell it. For a highly liquid ETF tracking the S&P 500, this spread might be just one or two cents per share. For a thinly traded niche ETF covering a narrow sector or obscure market, the spread can exceed 0.5%, which partially or fully offsets any advantage from the lower expense ratio. ETFs can also trade at a premium or discount to their net asset value (NAV), meaning you might occasionally overpay relative to the actual value of the underlying securities.
Why ETF Fees Are Structurally Lower: The Mechanics Behind the Gap
The cost difference between ETFs and mutual funds is not accidental. It is the product of fundamentally different operating structures that create different cost burdens on the fund itself.
When a mutual fund shareholder wants to sell their shares, they redeem them directly from the fund. The fund itself must handle this transaction, often by selling some of its underlying assets to raise the cash needed for the redemption. This requires active management, creates paperwork, and generates operational expenses that are ultimately borne by all shareholders. According to Investopedia, because mutual fund share redemptions require the fund to liquidate holdings, the fund company incurs ongoing operational costs that are passed through to investors via the expense ratio.
ETFs work differently. When one investor wants to sell ETF shares, they sell them to another investor on the open market, just like selling a stock. The ETF itself is not involved in the transaction. There are no assets to sell, no cash to raise, and no additional administrative burden placed on the fund company. This market-based trading mechanism dramatically reduces the operational complexity and cost of running an ETF, and those savings are passed on to investors through lower expense ratios.
The Tax Efficiency Dimension: A Structural Advantage ETFs Hold
Lower expense ratios are only part of the story. For investors holding funds in taxable brokerage accounts, the tax efficiency of their investment vehicle can be equally important, sometimes even more so. On this dimension, ETFs hold a structural advantage over most mutual funds that is rooted in the same creation and redemption mechanism that keeps their costs low.
When mutual fund shareholders sell shares, the fund must sell assets to meet redemptions. Those asset sales generate capital gains inside the fund, which the fund is required by law to distribute to all remaining shareholders at year’s end. This means mutual fund investors can receive a capital gains tax bill even in years when they did not sell a single share of their fund. According to Fidelity, it is rare for an index-based ETF to pay out a capital gain. When it does occur, it is usually due to some special unforeseen circumstance.
The contrast with mutual funds is striking. According to data from State Street Global Advisors, only 7% of ETFs paid a capital gain in 2025, compared with 52% of mutual funds. Looking at long-term averages since 2016, approximately 9% of ETFs distribute capital gains annually, versus 53% of mutual funds. For equity funds specifically, only 6% of equity ETFs paid a capital gain in 2025, compared with 57% of equity mutual funds. These are not marginal differences. They represent a profound structural gap in how much of your return you actually keep.
How In-Kind Redemption Explains ETF Tax Efficiency
The mechanism behind ETF tax efficiency is called in-kind creation and redemption. Understanding it helps clarify why this advantage is structural rather than coincidental.
Large institutional investors, called authorised participants, can create new ETF shares by delivering a basket of the underlying securities to the ETF manager. Conversely, they can redeem ETF shares by handing them back in exchange for the underlying basket of securities. Critically, this exchange of securities for shares does not involve any cash changing hands and does not constitute a sale for tax purposes inside the fund. As U.S. Bank explains, because institutional investors can contribute or receive securities in exchange for ETF shares, the ETF does not need to realise gains to meet redemption requests, and this avoids taxable gains being passed to remaining investors.
Furthermore, ETF managers can strategically use in-kind redemptions to flush low-basis securities (those with large embedded gains) out of the portfolio without triggering a taxable event. This is one of the more sophisticated aspects of ETF portfolio management. Active mutual fund managers simply do not have this tool available to them, which is one reason actively managed mutual funds in taxable accounts tend to be particularly tax-inefficient.
Real Numbers: The Long-Term Cost of Fee Differences
Abstract percentages become vivid when translated into actual dollars. The following table illustrates the compounding effect of different expense ratios on a $100,000 initial investment, assuming a consistent 8% gross annual return before fees, over 30 years.
| Expense Ratio | Net Annual Return | Value After 30 Years | Lost to Fees vs. 0.05% |
|---|---|---|---|
| 0.05% (broad index ETF) | 7.95% | $977,000 (approx.) | Baseline |
| 0.14% (average index ETF) | 7.86% | $957,000 (approx.) | ~$20,000 |
| 0.40% (low-cost mutual fund) | 7.60% | $900,000 (approx.) | ~$77,000 |
| 0.60% (avg. active mutual fund) | 7.40% | $862,000 (approx.) | ~$115,000 |
| 1.00% (higher-cost active fund) | 7.00% | $781,000 (approx.) | ~$196,000 |
These figures are illustrative but grounded in the compounding mathematics confirmed by sources including Western Southern Financial Group and TradeThatSwing. The pattern is clear: paying a higher expense ratio does not just cost you the fee amount each year. It costs you the compounded growth on every dollar that would otherwise have remained in your portfolio.
Active vs. Passive: The Fee Gap’s Deepest Root
The expense ratio difference between ETFs and mutual funds is, to a significant degree, a proxy for the difference between passive and active management. Most ETFs are passively managed index trackers. Most traditional mutual funds, particularly those sold through financial advisors and in older retirement plans, are actively managed. That active management is the primary reason mutual fund fees are higher.
An actively managed fund employs a team of analysts, portfolio managers, and researchers. It executes trades frequently, attempting to identify mispriced securities and outperform the market. All of that costs money. According to Charles Schwab, actively managed funds charge an average of 0.59%, while some passive ETFs and mutual funds charge nothing at all. The active management premium exists because fund companies charge for the service of trying to beat the market.
The problem, thoroughly documented by decades of academic research and performance data, is that most actively managed funds fail to outperform their passive benchmark over long periods, especially after fees. The S&P Indices Versus Active (SPIVA) scorecard, published twice annually, consistently shows that the vast majority of active large-cap funds trail the S&P 500 over 10- and 15-year periods. When the active manager’s higher fee is deducted, the performance gap widens further. Essentially, investors pay more for a service that, statistically, delivers less.
The Expense Ratio Landscape in 2024 and 2025
The good news for investors is that fees have been falling steadily for decades, driven by fierce competition among fund providers, the rise of passive investing, and the democratisation of low-cost index funds. According to Morningstar data cited by Western Southern Financial Group, the asset-weighted average expense ratio for all US mutual funds and ETFs ticked down to 0.34% in 2024 from 0.36% in 2023.
Vanguard, one of the pioneers of low-cost investing, reports that its average expense ratio across mutual funds and ETFs is 0.07%, which is 84% lower than the industry average of 0.44%, based on Morningstar data as of December 31, 2025. Fidelity’s zero-expense-ratio index funds remain available at no annual cost, though they are only available through Fidelity accounts and cannot be transferred to other brokerages. The competitive pressure from these providers has forced the broader industry toward lower fees, a development that has benefited all investors.
However, as Western Southern notes, averages mask wide variation. There are still actively managed mutual funds charging well above 1% annually. There are still ETFs in niche or complex strategy categories charging 0.75% or more. The existence of cheap options does not mean all options are cheap. Every investor must check the actual expense ratio of every fund they hold, not just assume that the cost is low because comparable funds have become cheaper overall.
ETF Inflows vs. Mutual Fund Outflows: What the Market Is Saying
The investment market has been voting with its dollars in a clear direction for years. According to State Street Global Advisors, US-listed ETFs saw $1.515 trillion in inflows in 2025, both a single-year record and a sign of the structural shift underway in the fund industry. At the same time, US-listed mutual funds experienced their second-largest annual outflow on record, losing $692 billion in net assets despite equity, bond, and commodity markets all ending the year higher.
This divergence is not primarily about performance. The underlying securities in comparable ETFs and mutual funds are often nearly identical. The shift is about cost, tax efficiency, and the structural advantages that ETFs offer in taxable accounts. Investors who have educated themselves about expense ratios and capital gains distributions are increasingly choosing to hold ETFs in taxable accounts, where those advantages compound most powerfully over time.
Furthermore, regulatory changes and increased financial literacy have made it easier for investors to understand what they are paying. The FINRA Fund Analyser allows any investor to enter a fund’s details and calculate the precise total cost of ownership, including the expense ratio, sales loads, and other fees over any chosen time horizon. Tools like this make the cost comparison between ETFs and mutual funds concrete and undeniable.
When Mutual Funds Still Make More Sense
Despite ETFs’ clear structural advantages in cost and tax efficiency, there are genuine situations where mutual funds remain the better choice. Ignoring these would give an incomplete picture.
The most important context is employer-sponsored retirement plans, particularly 401(k) plans. Most 401(k) plans offer mutual funds, not ETFs. Many do not offer ETFs at all. Within a 401(k) or other tax-advantaged account, the capital gains tax efficiency advantage of ETFs is essentially irrelevant, because you do not pay capital gains taxes on distributions inside a tax-deferred account. In this context, Western Southern Financial Group rightly notes that what matters most is finding the lowest-cost fund available within your plan’s options, regardless of whether that happens to be an ETF or a mutual fund.
A second advantage mutual funds hold is the ability to set up automatic investments of a precise dollar amount. Because ETFs trade like stocks, you must buy whole shares (though fractional shares are now widely available at major brokerages). With a mutual fund, you can instruct the fund to invest exactly $500 per month, or any other dollar amount, automatically. This makes dollar-cost averaging straightforward. For investors who prioritise seamless, automatic contributions, mutual funds may offer a more convenient mechanism. Third, some Vanguard index mutual funds are structured to be just as tax-efficient as their ETF equivalents, through a patented structure that allows the mutual fund to use the ETF share class to manage capital gains. For these specific funds, the tax efficiency advantage of choosing the ETF over the mutual fund is minimal.
Practical Comparison: Key Differences at a Glance
The following table summarises the most important structural differences between ETFs and mutual funds for everyday investors:
| Feature | ETF | Mutual Fund |
|---|---|---|
| Typical expense ratio (passive) | 0.05% to 0.20% | 0.10% to 0.40% (index); 0.50% to 1.00%+ (active) |
| Sales loads | None | Possible (up to 5.75% front-end) |
| 12b-1 fees | Rare | Common in advisor-sold funds (up to 1%) |
| Bid-ask spread cost | Yes (small for liquid ETFs) | None |
| Capital gains distributions | Rare (~7% of ETFs in 2025) | Common (~52% of mutual funds in 2025) |
| Intraday trading | Yes, like a stock | No, priced once daily at NAV close |
| Automatic investments | Possible (fractional shares available) | Easy, any dollar amount |
| Minimum investment | Price of one share (often under $100) | Often $1,000 to $3,000, some with no minimum |
| Best account type | Taxable brokerage accounts | Tax-advantaged accounts (401k, IRA) |
The Tax Drag Problem: How Capital Gains Distributions Erode Returns
The concept of tax drag deserves deeper examination because it is one of the most underappreciated threats to long-term investment returns. In a taxable account, capital gains distributions from mutual funds create a tax bill that must be paid in the year the distribution occurs, regardless of whether you sold anything. That payment reduces the cash available to remain invested, which creates an additional drag on compounding beyond the expense ratio itself.
According to analysis from Nasdaq, the average mutual fund loses approximately 1.5% of its returns to taxes each year in a taxable account. Over 20 years on a $1 million portfolio, this could amount to as much as $1.9 million in foregone returns. Even on smaller portfolios, the numbers are significant. An investor with $100,000 paying 1.5% in annual tax drag gives up roughly $190,000 in potential wealth over 20 years, compared with a tax-efficient alternative with the same gross performance.
According to Alpha Exc Capital, taxes can consume between 1% and 2% of annual returns in taxable accounts for investors in actively managed mutual funds. This is an invisible cost that does not appear in the fund’s expense ratio, does not appear in any marketing material, and is rarely discussed in conversations about fund selection. Yet it rivals or exceeds the stated expense ratio in terms of its long-term impact on wealth accumulation.
Index Funds: Where ETF and Mutual Fund Converge
It is worth addressing a nuance that gets lost in the ETF-versus-mutual-fund framing: the sharpest distinction is really between passive index investing and active management, not between the ETF and mutual fund wrapper per se. Low-cost index mutual funds from providers like Vanguard, Fidelity, and Schwab can offer expense ratios comparable to or in some cases lower than similar ETFs.
For investors holding funds inside tax-advantaged accounts such as IRAs or 401(k) plans, the tax efficiency advantage of ETFs is largely neutralised, and the choice between an index ETF and an index mutual fund at similar cost becomes mostly a matter of convenience and account access. Both will track the same benchmark, generate similar returns, and produce similar long-term outcomes. As the Bogleheads community has noted, for large, well-run index funds from reputable providers, the distinction between the ETF and mutual fund wrapper is often less important than investors assume, particularly when both are offered commission-free and without sales loads.
The critical point is this: choosing a passive index fund, whether in ETF or mutual fund form, over an actively managed alternative with a higher expense ratio is the single most impactful fee-related decision most investors can make. The wrapper is secondary to the underlying cost and management philosophy.
How to Evaluate an ETF or Mutual Fund Before You Invest
Given everything above, here is a practical checklist for evaluating any fund before committing capital to it. These steps apply whether you are comparing ETFs, mutual funds, or both.
First, find the expense ratio. It is listed in every fund’s prospectus and on the fund provider’s website. Compare it against the average for its category. A broad US equity index fund charging more than 0.20% deserves scrutiny. Second, check for additional costs. For mutual funds, look for sales loads and 12b-1 fees. For ETFs, look up the average bid-ask spread and the fund’s average daily trading volume. A low-volume ETF with a wide spread may cost you more to trade than its expense ratio suggests.
Third, review the fund’s capital gains distribution history, particularly if you are investing in a taxable account. A mutual fund that has distributed large capital gains in recent years is likely to continue doing so. Fourth, assess tracking error for index funds. A fund that consistently lags its benchmark by more than its expense ratio suggests poor management or high internal transaction costs. Fifth, consider the account type. In a taxable account, favour ETFs or tax-managed funds. In a tax-advantaged account, focus primarily on expense ratio and fund quality rather than tax structure.
The Role of Broker Commissions and Their Near-Disappearance
One historical argument against ETFs was trading commissions. If your broker charged $10 per trade, buying ETFs frequently as part of a dollar-cost averaging strategy would rack up meaningful costs, partially eroding the expense ratio advantage. That argument is now largely obsolete.
Major US brokerages, including Charles Schwab, Fidelity, Vanguard, and Vanguard Brokerage Services, have eliminated commissions on ETF trades. The commission-free ETF trading environment that now prevails across most major platforms effectively removes one of the last remaining practical advantages of mutual funds over ETFs for regular contributors. Fractional shares, now widely available, further close the gap by allowing investors to invest precise dollar amounts into ETFs rather than needing to purchase whole shares.
The remaining practical advantages of mutual funds over ETFs in the day-to-day investment experience have therefore shrunk considerably. The ability to set up recurring automatic investments is available for ETFs at brokerages that support fractional shares and automatic ETF purchases. As Vanguard noted, effective January 2025, investors can set up recurring investments into Vanguard ETF positions, a feature that was previously available only for mutual funds at most providers.
Portfolio Construction: Matching Fund Type to Account Type
Putting all of these considerations together, a clear framework for portfolio construction emerges. The guiding principle is to match the most tax-efficient vehicles to your taxable accounts, and to focus purely on cost and fund quality for your tax-advantaged accounts.
In a taxable brokerage account, low-cost index ETFs are typically the optimal choice for equity exposure. Their structural tax efficiency, combined with low expense ratios, means you keep more of each year’s return both in the present (lower fees) and at tax time (fewer capital gains distributions). For fixed income in taxable accounts, municipal bond funds or ETFs may offer additional tax advantages through federally tax-exempt interest income. In tax-advantaged accounts such as 401(k)s, traditional IRAs, and Roth IRAs, use whatever low-cost index funds are available, whether ETFs or mutual funds. Focus on the expense ratio and whether the fund tracks a sensible, broad benchmark. Tax efficiency becomes irrelevant inside these accounts because no capital gains distributions create a current-year tax bill.
For investors who primarily save through employer plans that offer only mutual funds, the strategy is straightforward: find the lowest-cost index funds in the plan and use those. Actively managed funds in 401(k)s are rarely worth their higher fees. If your plan offers only high-cost actively managed funds, that is worth raising with your employer’s HR or benefits team, as plan sponsors have a fiduciary duty to offer reasonable-cost investment options.
A Note on Niche and Complex ETFs
Not all ETFs are cheap, tax-efficient, passive index trackers. The ETF structure has expanded enormously in recent years to include leveraged ETFs, inverse ETFs, actively managed ETFs, derivative income ETFs, and funds targeting highly specific market niches ranging from cannabis companies to space exploration stocks. Many of these carry expense ratios well above 0.50%, some above 1%, and the leveraged and inverse varieties carry additional structural costs from daily rebalancing that compound against long-term holders.
The proliferation of complex ETF products means that investors should not assume that any ETF is cheap or tax-efficient simply because it wears the ETF label. According to State Street Global Advisors, even among alternative ETFs, 23% of fixed income ETFs distributed capital gains in 2025, compared with 7% for all ETFs overall. The structural advantage is real, but it is strongest for broad, passive index ETFs with high liquidity and low turnover. It becomes weaker and sometimes disappears entirely for actively managed, leveraged, or narrow-focus ETFs.
The Compounding Power of Minimised Costs Over Time
Everything in this post circles back to one central principle. Compounding works in both directions. Your wealth compounds upward when you invest consistently and earn returns. Your costs compound downward, silently eroding what would otherwise be yours. Every basis point saved in an expense ratio is a basis point that compounds in your favour for every remaining year of your investment horizon.
The difference between a 0.05% expense ratio and a 0.60% expense ratio might sound negligible in any given year. On $10,000, that is a difference of $55. Over 30 years on a growing portfolio, that $55 annual difference compounding at 8% grows into the tens of thousands of dollars in lost wealth. Multiply that across a portfolio of $250,000 or $500,000, and you can see why expense ratio discipline is one of the most reliable and controllable drivers of long-term investment success.
The choice between ETFs and mutual funds is ultimately about identifying which vehicle best serves your specific situation: your account type, your contribution habits, your tax situation, and the funds available to you. In many cases, particularly in taxable accounts, the answer increasingly favours broad, low-cost index ETFs. In others, particularly inside tax-advantaged employer plans, a low-cost index mutual fund will serve you equally well. The specific wrapper matters less than the principles underneath: keep costs relentlessly low, favour passive index strategies, minimise tax drag in taxable accounts, and let compounding work unimpeded for as many years as possible.
Spend some time for your future.
To deepen your understanding of today’s evolving financial landscape, we recommend exploring the following articles:
War Economy Chapter 17: Inflation, Hyperinflation, and Wartime Price Controls
Beyond Nvidia: Why Humanoid Robot Stocks Are Taking Off
How CBOE and Lockheed Martin Became Geopolitical Hedges
Attracting Gen Z Clicks: What Works in Advertising to Gen Z Clients
Explore these articles to get a grasp on the new changes in the financial world.
Disclaimer
This article is provided for informational and educational purposes only and does not constitute financial, tax, or investment advice. All figures and examples are illustrative and do not guarantee future results. Tax treatment of investment income varies by individual circumstance. Please consult a qualified financial advisor, tax professional, or investment planner before making any investment decisions. Past performance of any fund or investment strategy is not indicative of future results.
References
- [1] TradeThatSwing, “How ETF Expense Ratios Affect Investment Performance and Returns.” [Online]. Available: https://tradethatswing.com/are-my-etfs-or-mutual-funds-too-expensive-see-how-much-it-is-costing-you-its-a-lot/
- [2] Western Southern Financial Group, “ETF vs Mutual Fund: Key Differences That Matter,” March 2026. [Online]. Available: https://www.westernsouthern.com/investments/etf-vs-mutual-fund
- [3] Investopedia, “ETF vs. Mutual Fund Fees: How to Compare Them.” [Online]. Available: https://www.investopedia.com/articles/investing/102915/why-are-etf-fees-lower-mutual-funds.asp
- [4] State Street Global Advisors, “What Is an ETF Expense Ratio and Why Does It Matter?” [Online]. Available: https://www.ssga.com/us/en/individual/resources/education/what-are-etf-expense-ratios-and-why-do-they-matter
- [5] Charles Schwab, “ETF vs. Mutual Fund: It Depends on Your Strategy.” [Online]. Available: https://www.schwab.com/learn/story/etf-vs-mutual-fund-it-depends-on-your-strategy
- [6] Fidelity, “ETFs vs. Mutual Funds: Tax Efficiency.” [Online]. Available: https://www.fidelity.com/learning-center/investment-products/etf/etfs-tax-efficiency
- [7] State Street Global Advisors, “Tax Efficiency Is Structural: ETFs Continue to Issue Fewer Capital Gains Than Mutual Funds,” February 2026. [Online]. Available: https://www.ssga.com/us/en/individual/insights/tax-efficiency-is-structural-etfs-continue-to-issue-fewer-capital-gains-than-mutual-funds
- [8] U.S. Bank, “ETF vs. Mutual Fund: What’s the Difference?” January 2026. [Online]. Available: https://www.usbank.com/investing/financial-perspectives/investing-insights/etfs-vs-mutual-fund.html
- [9] Alpha Exc Capital, “Tax Efficiency ETF vs Mutual Fund,” 2026. [Online]. Available: https://www.alphaexcapital.com/etfs/etf-investing-basics/etf-vs-mutual-fund/tax-efficiency-etf-vs-mutual-fund
- [10] Nasdaq, “Tax Efficiency: Comparing ETFs and Mutual Funds.” [Online]. Available: https://www.nasdaq.com/articles/tax-efficiency:-comparing-etfs-and-mutual-funds
- [11] Vanguard, “ETFs vs. Mutual Funds: Should I Invest in Mutual Funds or ETFs?” [Online]. Available: https://investor.vanguard.com/investor-resources-education/etfs/etf-vs-mutual-fund
- [12] TheStreet, “Tax Efficiency: ETF vs. Mutual Fund,” October 2025. [Online]. Available: https://www.thestreet.com/taxes/tax-efficiency-etf-vs-mutual-fund-turbotax
- [13] FINRA, “Fund Analyser Tool.” [Online]. Available: https://www.finra.org/investors/tools-and-calculators/fund-analyzer
- [14] Bogleheads Forum, “Are Mutual Funds Really Less Efficient at Taxes vs. ETFs?” September 2024. [Online]. Available: https://www.bogleheads.org/forum/viewtopic.php?t=440006
- [15] Investopedia, “S&P Indices Versus Active (SPIVA) Scorecard.” [Online]. Available: https://www.investopedia.com/terms/s/spiva.asp