
The Taylor Swift Economic Effect: How One Artist’s Tours Move Entire City Economies
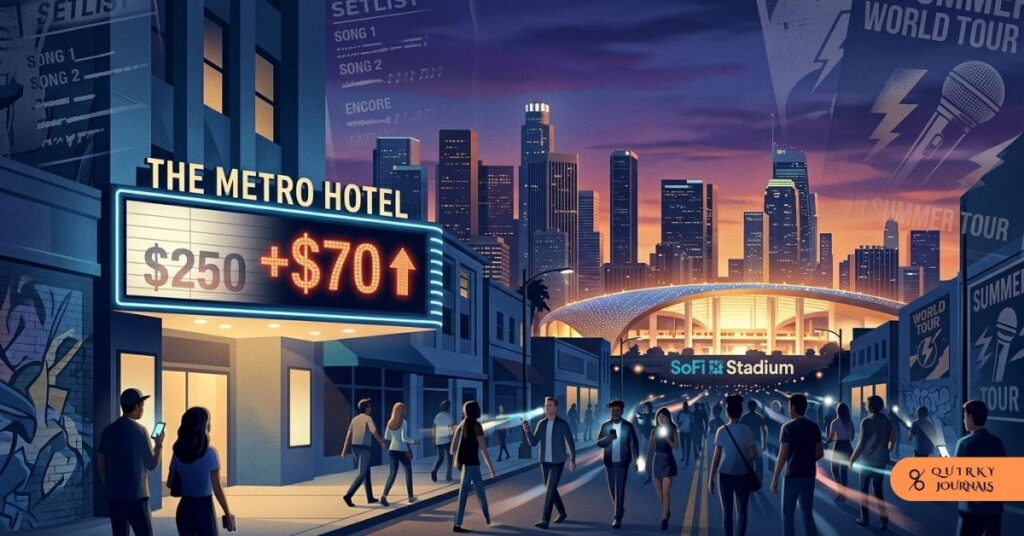
A hotel room in Los Angeles jumped by $70 in a single week. Not because of a holiday. Not because of a convention. Because Taylor Swift announced six nights at SoFi Stadium, and every hotelier within driving distance quietly raised the rate before the ink dried on the tour dates. If you work in economic development or sit on a tourism board, that single data point should make you sit up straight.
For years, “economic impact” from big events got treated like marketing copy: a nice line for a press release nobody bothered to fact-check. Then the Eras Tour rolled through 20 U.S. cities and forced economists, mayors, and hotel chains to actually run the numbers. What they found reshaped how city planners think about touring artists altogether, and it is more useful, and more complicated, than the headlines suggest.
This piece breaks down what actually happened, city by city and dollar by dollar. It also covers what the skeptics get right, because plenty of “economic impact studies” are inflated projections dressed up as science. And it closes with a practical framework your office can use the next time a stadium tour lists your city as a stop. We are not selling hype here. We are giving you tools to separate real revenue from wishful thinking.
The Number That Should Interest Every City Council
Start with Los Angeles County, because it has the cleanest paper trail. Six nights of the Eras Tour in Inglewood produced an estimated $320 million bump to county GDP, a 3,300-person increase in area employment, and $160 million in local earnings. That is direct, indirect, and induced impact combined, which sounds abstract until you translate it into payroll checks for bartenders, rideshare drivers, and hotel housekeepers.
Zoom out to the national picture and the scale gets almost silly. Across 20 U.S. tour stops, Swifties spent an estimated $5 billion directly in host cities, averaging $1,300 per attendee on travel, hotels, food, and merchandise. U.S. Travel has been upfront that this figure is conservative, since it only counts documented direct spending and skips the ripple effects entirely.
Smaller markets felt it too. Two shows in Denver added $140 million to Colorado’s GDP, roughly 0.3 percent of the state’s monthly output from two nights of programming. And the spending did not stay confined to the stadium gates. A Mastercard Economics Institute analysis found restaurant spending within a 2.5-mile radius of tour venues jumped an average of 68 percent per day during the shows, tapering to a still-notable 7 percent boost across a wider 10-mile radius.
| Metric | Figure |
|---|---|
| LA County GDP impact (6 shows) | $320 million |
| National direct spending (20 cities) | $5 billion |
| Average spend per attendee | $1,300 |
| Denver GDP impact (2 shows) | $140 million |
| Restaurant spending lift (2.5-mile radius) | +68% per day |
Show Me the Money: The International Tour Stops
Once the tour left U.S. borders, the numbers got even more dramatic, and considerably harder to verify with a single methodology. Still, the pattern held everywhere the tour landed.
- London: eight shows generated an estimated £300 million (about $380 million) for the local economy, per tourism agency London & Partners.
- Tokyo: four dates were projected to add roughly $228 million for Japan and $163 million for Tokyo specifically, according to the Economic Impact Research Laboratory.
- Melbourne: Australia’s Lord Mayor put the figure at $1.2 billion AUD, close to $766 million USD, for seven combined Melbourne and Sydney dates.
- Vancouver: Destination Vancouver projected $97 million from direct hospitality spending alone, generating $27 million in tax revenue.
- Singapore: Maybank estimated between $260 million and $375 million in tourism revenue from just six dates, boosted by the city being the only Southeast Asian stop on the entire tour.
- New Orleans: around $200 million, tied to roughly 200,000 tickets sold.
Two international stops deserve special attention because they show how far this ripples. In Buenos Aires, Airbnb rates soared to 12 times their usual level during tour dates, with hotels hitting full occupancy. Amsterdam saw an estimated $33 million in consumer spending on hotels, food, and public transit tied directly to the tour dates. Meanwhile, the Federal Reserve’s own Beige Book took note of the phenomenon in the U.S., flagging Philadelphia’s May 2023 hotel revenue as the strongest since before the pandemic, largely attributable to the concerts.
It’s Not Just Taylor: The Beyoncé Bump
Before anyone assumes this is a one-artist phenomenon, consider Beyoncé’s Renaissance World Tour, which ran roughly parallel to the Eras Tour in 2023. Estimates put its total American economic contribution near $4.5 billion, a figure the New York Times compared to the economic footprint of the 2008 Beijing Olympics. In a single month alone, the tour reportedly generated $179 million, per Billboard’s reporting.
Fan spending backed up the scale. QuestionPro’s research found Renaissance concertgoers spent an average of $1,870 per show, edging out even Swiftie spending, with 91 percent of fans saying they would attend again given the chance. City-level numbers followed the same pattern seen with Swift. Atlanta generated more than $55 million in a single weekend, and Houston hotels ran above 95 percent occupancy during her hometown stop.
Two smaller data points illustrate how fast this spending moves through a local economy. Ahead of the Philadelphia stop, Yelp reported searches for nail technicians nearly tripled, wig searches rose 81 percent, and dive bar searches jumped 160 percent, all within the week leading up to the show. And when Beyoncé opened the tour in Stockholm, Swedish economists partly credited her for an unexpected bump in May inflation figures, a reminder that this kind of spending surge shows up in macro data, not just local anecdotes.
Bad Bunny’s Homecoming Residency
Bad Bunny’s 2025 residency in San Juan, “No Me Quiero Ir de Aquí,” offers the clearest test case for how much methodology matters. Thirty-one shows drew more than 600,000 visitors and an estimated 48,000 hotel stays, generating close to $200 million in direct economic impact during what is normally a slow tourism season for the island.
Other researchers landed on very different numbers. A University of Puerto Rico economist calling her own study conservative found a minimum of $176.6 million, mostly from documented wages and taxes. Discover Puerto Rico, the island’s tourism board, cited a much wider range of $400 million to $700 million. Meanwhile a University of Puerto Rico creative-sector analysis broke it down further, estimating $27 million in direct attendee spending and another $26.5 million in indirect impact as that money circulated through the local economy.
Local tour operators felt it concretely, reporting a 14 percent jump in booking revenue during the residency window. Visa’s consumer spending data backed this up, showing international cardholder spending in San Juan increased more than 35 percent compared to the year before. The lesson for planners: three credible studies, three different price tags, all pointing the same direction. Directionally right, precisely wrong, is the honest way to describe most of these figures.
How the Multiplier Effect Actually Works
None of these numbers make sense without understanding the multiplier effect, the concept economists use to explain why a single ticket purchase ripples so far beyond the box office. The basic idea: initial spending by a visitor gets re-spent by the business that receives it, which gets re-spent again by whoever that business pays, and so on until the money leaks out of the local economy entirely.
Economists express this as total impact equals initial spending multiplied by a multiplier value, where the multiplier depends on how much of each dollar stays local versus leaks out to national chains, imports, or savings. A hotel that buys food from local farmers keeps more of the money circulating than one that orders from a national distributor.
This is exactly why “direct spending” and “total economic impact” are not the same number, and confusing the two is where a lot of press releases go wrong. Destination Toronto’s own Eras Tour estimate separated the two carefully: $152 million in total direct spending, with $141 million of that coming specifically from out-of-town visitors rather than locals who would have spent money in the city regardless. That distinction, out-of-town money versus local money simply changing hands, is the single most important thing to check before you cite any impact figure publicly.
Researchers analyzing smaller regional concerts have used a cleaner method to test this: comparing taxable retail sales data before, during, and after a show, rather than relying on attendee surveys alone. A widely cited regional analysis found that this kind of tax-receipt approach helps strip out the substitution and crowding-out effects that inflate so many event-driven estimates, because it measures what actually got sold rather than what attendees say they planned to spend. If your city has access to point-of-sale tax data, use it. Surveys measure intentions. Receipts measure reality, and reality is what your budget office actually needs.
The Skeptics Have a Point
Before your office gets too excited, it is worth sitting with why sports and event economists have spent decades pushing back on inflated impact claims. Two problems come up constantly in the academic literature.
First, the substitution effect: if a local resident spends money at a Taylor Swift concert instead of at a movie theater or restaurant that same weekend, that is not new economic activity. It is the same dollar changing where it gets spent, not multiplying. Second, the crowding-out effect: cities that already attract tourists sometimes just swap one type of visitor for another, rather than adding net new demand.
Researchers have documented this pattern extensively with stadiums and mega-events. A widely cited analysis of sporting-event impact studies found that promoter-sponsored figures routinely overstate real gains, largely by ignoring both effects above. An NBER working paper on Olympic host cities noted that economists remain broadly skeptical of mega-event benefits, even though policymakers and the public rarely share that skepticism. Portland’s long-running Rose Festival became a local case study in this exact problem, with wildly inconsistent impact figures that economists routinely dismiss as inflated. Sports economist J.C. Bradbury has spent years urging officials to treat any “this time will be different” impact claim with default suspicion, backed by decades of consistent research showing publicly funded venues rarely deliver the promised returns.
Touring concerts differ from permanent stadiums in one meaningful way: they genuinely pull in out-of-town visitors who would not otherwise be in your city that weekend, rather than simply reallocating a fixed local entertainment budget. But some share of every concert crowd is local. Treat that portion with the same skepticism you would apply to any other substitution spending, and your numbers will hold up under scrutiny far better than a press release will.
The Pattern Repeats Beyond Pop’s Biggest Names
Skeptics sometimes wave this off as a Taylor Swift or Beyoncé quirk, two once-in-a-generation fandoms that happen to travel with wallets open. The data says otherwise. Coldplay’s stop in Abu Dhabi, mentioned earlier for its startling hotel price spike, was not an isolated case. BLACKPINK’s January 2023 concerts in Hong Kong coincided with the city receiving more than 600,000 visitors that month, a sharp jump from prior months. Ed Sheeran’s nine-date Ireland tour in 2018 contributed an estimated €50 million to the local economy, with Dublin hotels running at full occupancy for the duration.
Coldplay’s Music of the Spheres Tour grossed $421.7 million globally in 2024, drawing crowds as large as 96,000 per show. In Melbourne and Sydney specifically, hotel occupancy and average daily rate climbed as much as 81 percent and 61 percent respectively during concert dates, pushing peak nightly rates to $754 in Melbourne and $808 in Sydney. None of these artists share a genre, a fanbase demographic, or even a home country. What they share is scale, and scale is what triggers this economic pattern regardless of who is holding the microphone.
For a city planner, the practical takeaway is this: do not wait for the next Taylor Swift to build your playbook. K-pop acts, Latin trap superstars, British singer-songwriters, and stadium rock bands are all capable of producing the same hotel occupancy spike and small-business windfall. The framework in this article applies regardless of genre. What matters is ticket volume, tour length, and whether your city has a plan ready before the tour bus arrives.
The Uncomfortable Side: Who Actually Captures the Gains
Here is where the story gets less flattering. During the Eras Tour’s Los Angeles stop, hotel workers represented by Unite Here Local 11 staged rolling strikes at more than 60 properties, arguing that hotels were “doubling and tripling” their rates while staff saw none of the extra revenue, with some workers reportedly sleeping in their cars between shifts.
The revenue data backs up their frustration in an interesting way. STR reported the tour added $208 million in additional U.S. hotel room revenue from June through early August, yet Los Angeles specifically saw only a modest $42 bump in RevPAR compared to other tour markets, suggesting the strike genuinely dented the local capture of that windfall. In the month before the LA shows, hotel prices had already climbed 7.7 percent year over year according to OTA Insight, with peak-Saturday rooms running $70 above the previous week and citywide rates up 17 percent from thirty days prior.
This is not unique to Swift’s tour. Coldplay’s stop in Abu Dhabi reportedly pushed hotel prices up by as much as 375 percent, and Toronto’s tourism office documented a genuine hospitality labor shortage during its own Swift dates. The pattern worth remembering: price spikes tend to benefit hotel ownership and short-term rental hosts first, and only reach workers and small local businesses if a city actively plans for that outcome.
Building a Strategic Tourism Plan: What City Planners Can Actually Do
None of the upside above is automatic, and none of the downside above is inevitable. Both depend heavily on preparation. Here is a practical breakdown organized around the tour timeline.
Before the Announcement
The window between a routing rumor and an official tour date announcement is short, so preparation has to start early.
- Monitor booking agency and venue announcements for early signals of major tours in your region.
- Coordinate with hotel associations on capacity planning and, where possible, fair labor practices ahead of a demand spike, rather than reacting to a strike mid-event.
- Publish a standing strategic tourism plan, the way Scottsdale, Arizona tracks its objectives on a public dashboard, so a big event slots into existing infrastructure instead of catching your office flat-footed.
- Loop in transit authorities early. Traffic and transit strain is often the first visible sign a tour stop is coming.
During the Event Window
Once the tour dates arrive, the priority shifts from planning to execution and small-business inclusion.
- Promote independent restaurants and retailers near the venue directly, since national chains capture disproportionate visitor spending by default.
- Track real-time hotel occupancy and local sales tax collections instead of waiting for a post-event report months later.
- Plan for genuine environmental and waste impacts, an underdiscussed cost of any large temporary crowd.
- Keep public safety and hospitality staffing levels realistic. Understaffed hotels and venues quietly erode the visitor experience your city is trying to sell.
After the Encore
The tour leaves, but the real measurement work begins once it does.
- Pull actual sales and hotel occupancy tax receipts rather than relying on promoter-supplied projections.
- Feed verified numbers into your next tourism bid or grant application, building the kind of track record that helped Scottsdale’s dashboard model earn credibility over time.
- Consider reinvesting a share of the windfall tax revenue into affordable housing or hospitality wage support, directly addressing the strain documented in Los Angeles.
- Use the case study for marketing. American University now offers an entire course built around this phenomenon, evidence that a single tour stop can generate institutional credibility long after the final encore.
A Practical Framework for Measuring Your Own City’s Impact
Skip the vibes-based estimate. Here is what to actually track, and why each metric matters more than a single headline number.
| Metric | Data Source | Why It Matters |
|---|---|---|
| Hotel RevPAR and occupancy vs. baseline | STR or similar hospitality data provider | Hard to manipulate, directly comparable across events |
| Sales and hotel occupancy tax receipts | City finance department | Measures revenue actually captured, not projected |
| Ticket sales by buyer zip code | Venue or promoter data sharing agreement | Separates genuine out-of-town spending from local substitution |
| Nearby restaurant and retail spending | Card-network or point-of-sale partners | Shows whether small businesses actually benefited |
| Short-term rental listings and pricing | Rental platform data | Flags housing market strain early |
| Overtime and city service costs | City budget office | Full accounting requires subtracting costs, not just adding revenue |
Run these six data points before and after any major tour stop, and you will have a defensible number, one that survives a city council meeting or a skeptical local journalist, instead of a press-release figure that collapses under a single follow-up question.
Budgeting for the Downside, Not Just the Upside
Every economic development office loves presenting the revenue side of an event. Fewer want to present the cost side, and that reluctance eventually catches up with a city’s credibility. A serious tourism plan accounts for both.
Overtime pay for police, transit, and sanitation crews rarely makes it into the press release, but it shows up in the budget the following quarter. Short-term housing strain, the kind that pushed Buenos Aires Airbnb rates to twelve times their normal level, can price out residents even after the tour leaves town. And labor disputes, like the one that dogged the Los Angeles Eras Tour stop, carry real reputational cost, both for the hotels involved and for the city that failed to get ahead of it.
None of this means big tours are a bad bet. The Los Angeles numbers alone, $320 million in GDP against a comparatively modest strain on city services, make the math favor hosting these events in almost every case. But a budget presentation that only shows revenue and skips costs is not a full accounting. It is a sales pitch, and city councils deserve better than a sales pitch when real dollars and real workers are involved.
Case Snapshot: Minneapolis and the Convention Bureau Playbook
Minneapolis offers a useful model for turning a single big event into ongoing momentum. Meet Minneapolis, the city’s tourism bureau, brought in more than 700 events in a single year, including a Taylor Swift concert, setting local hotel occupancy records in the process. That track record directly helped the bureau land the American Public Health Association’s annual meeting the following year, an event expected to bring roughly 12,000 attendees to the city.
The lesson is not that one concert built an entire convention pipeline by itself. It is that Minneapolis treated the tour stop as proof of capacity rather than a one-off windfall, then used it as leverage in the next pitch meeting. That is the actual long-term return on investment: not the weekend receipts, but the credibility those receipts buy with the next event organizer deciding where to book.
Legal Disclaimer
This article is provided for general informational purposes only and does not constitute financial, economic, or legal advice. Economic impact figures cited here originate from third-party studies, tourism boards, and media reports using varying methodologies, and actual results in any given city may differ materially. Readers should consult qualified economic development professionals and independently verify data before relying on it for policy or budget decisions.
What This Means for Your Next Fiscal Year
Big tours will keep coming, and the artists booking stadium runs keep multiplying, from Beyoncé to Bad Bunny to Coldplay. The cities that win are not the ones that post the biggest headline number after the fact. They are the ones that had a hotel labor agreement in place before the first ticket sold, a small-business marketing plan ready before the first fan landed at the airport, and a measurement framework built before anyone needed to defend the number in a budget meeting. Pull your city’s own baseline data now, before the next tour announcement lands in your inbox. When it does, you will already know exactly what to measure, what to demand from promoters and hotel partners, and what a defensible number actually looks like. That preparation is worth more than any single weekend of ticket sales. It is also the difference between a city that gets treated as a footnote on a routing spreadsheet and one that promoters actively want to book, because word travels fast in that industry too. Tour managers and promoters talk to each other about which cities made load-in easy, which hotel blocks caused headaches, and which local governments handled a crowd of 70,000 without a public relations disaster. Build that reputation once, and it compounds. The next artist’s booking agent does not need convincing. Your last tour stop already did the convincing for you.
References
- Center for Jobs and the Economy, “Special Report: Taylor Swift’s Impact on the Economy in Los Angeles County,” 2023. [Online]. Available: https://centerforjobs.org/ca/special-reports/special-report-taylor-swifts-impact-on-the-economy-in-los-angeles-county
- U.S. Travel Association, “The Taylor Swift Impact – 5 Months and $5+ Billion,” Sept. 19, 2023. [Online]. Available: https://www.ustravel.org/news/taylor-swift-impact-5-months-and-5-billion
- C. Murray, “Taylor Swift’s Eras Tour Boosted These Cities’ Economies The Most,” Forbes, Dec. 6, 2024. [Online]. Available: https://www.forbes.com/sites/conormurray/2024/12/06/these-cities-reported-the-biggest-economic-boosts-from-taylor-swifts-eras-tour-as-tour-wraps-up-in-vancouver
- Michigan Journal of Economics, “The Economic Impact of ‘The Eras Tour’,” Jan. 11, 2026. [Online]. Available: https://sites.lsa.umich.edu/mje/2026/01/11/the-economic-impact-of-the-eras-tour
- Emory Economics Review, “‘Swiftonomics’: How the Eras Tour Boosted the Global Economy,” Nov. 16, 2024. [Online]. Available: https://emoryeconomicsreview.org/articles/2024/11/16/swiftonomics-how-the-eras-tour-boosted-the-global-economy
- S. Yongo, “What Beyoncé’s Renaissance World Tour Says About The Economic Impact Of Black Women,” Forbes, Oct. 2, 2023. [Online]. Available: https://www.forbes.com/sites/sughnenyongo/2023/10/02/what-beyoncs-renaissance-world-tour-said-about-the-economic-impact-of-black-women/
- Defender Network, “Beyoncé’s tour boosts city economies, sets new records,” Jul. 24, 2025. [Online]. Available: https://defendernetwork.com/news/opinion/beyonce-cowboy-carter-tour-economy/
- QuestionPro, “The economic impact of Beyonce’s Renaissance World Tour,” 2023. [Online]. Available: https://www.questionpro.com/research/beyonce-study/
- R. Shin, “Yelp coins the ‘Beyoncé bump’ for the economic halo created by the pop star’s Renaissance Tour,” Fortune, Jul. 19, 2023. [Online]. Available: https://fortune.com/2023/07/19/beyonce-renaissance-tour-economic-impact
- D. Melville, “After Adding $200 Million To Puerto Rico’s Economy, Bad Bunny’s Residency Is Ending,” Forbes, Sept. 8, 2025. [Online]. Available: https://www.forbes.com/sites/dougmelville/2025/09/08/bad-bunnys-residency-which-added-200-million-to-puerto-ricos-economy-wraps-next-week/
- Rolling Stone, “How Much Did Bad Bunny’s Residency Generate for Puerto Rico’s Economy?,” Dec. 28, 2025. [Online]. Available: https://www.rollingstone.com/music/music-latin/bad-bunny-economic-impact-residency-puerto-rico-1235490958/
- Invest Puerto Rico, “Bad Bunny’s Residency Shows Creative Economy Power,” Aug. 13, 2025. [Online]. Available: https://www.investpr.org/the-big-lesson-from-bad-bunnys-residency/
- Fox5 Vegas, “Puerto Rico economy booms from Bad Bunny’s residency concert tour,” Feb. 8, 2026. [Online]. Available: https://www.fox5vegas.com/2026/02/08/puerto-rico-economy-booms-bad-bunnys-residency-concert-tour/
- FareHarbor, “Bad Bunny Tour Increases Tour & Activity Revenue,” Oct. 14, 2025. [Online]. Available: https://fareharbor.com/blog/the-bad-bunny-effect-how-a-residency-boosted-local-operator-revenue-by-14/
- Visa, “Visa Insights: Bad Bunny Residency Boosted Puerto Rico’s Economy,” 2025. [Online]. Available: https://caribbean.visa.com/services/visa-consulting-analytics/report-bad-bunny-puerto-rico-residency.html
- Five Seconds Flat, “Concert Tourism – How Concertgoers Are Fueling a New ‘Travel Economy’,” Nov. 1, 2024. [Online]. Available: https://www.fivesecondsflat.com/blog/concert-tourism-how-concertgoers-and-live-music-fans-are-fueling-a-new-travel-economy
- The Sport Journal, “Upon Further Review: An Examination of Sporting Event Economic Impact Studies,” Oct. 12, 2016. [Online]. Available: https://thesportjournal.org/article/upon-further-review-an-examination-of-sporting-event-economic-impact-studies/
- A. K. Rose and M. M. Spiegel, “The Olympic Effect,” NBER Working Paper Series, w14854. [Online]. Available: https://www.nber.org/system/files/working_papers/w14854/w14854.pdf
- ThinkingOregon, “Portland Rose Festival: Why The Secrecy?,” Jun. 6, 2023. [Online]. Available: https://thinkingoregon.org/2023/05/31/portland-rose-festival-why-the-secrecy/
- City Observatory, “Portland’s advanced seminar on sports economics.” [Online]. Available: https://cityobservatory.org/portlands-advanced-seminar-on-sports-economics/
- J. C. Bradbury, “Do Sports Stadiums Help Local Economies?” [Online]. Available: https://jcbradbury.com/stadium-economic-impact/
- Hotel Dive, “Taylor Swift tour boosts US hotel room revenue by $208M,” Sept. 5, 2023. [Online]. Available: https://www.hoteldive.com/news/taylor-swift-tour-boosts-hotel-room-revenue/692687/
- Hotel Dive, “Taylor Swift urged to cancel LA concerts over hotel strike,” Aug. 4, 2023. [Online]. Available: https://www.hoteldive.com/news/taylor-swift-asked-to-cancel-la-eras-tour-amid-hotel-strike/690004/
- CBS News, “‘Stand with us;’ Striking hotel workers ask Taylor Swift to postpone SoFi Stadium shows,” 2023. [Online]. Available: https://www.cbsnews.com/amp/losangeles/news/stand-with-us-striking-hotel-workers-ask-taylor-swift-to-postpone-sofi-stadium-shows
- TRG International, “Strategies for Hotels to Capitalize the Rise of Concert Tourism,” Aug. 2, 2025. [Online]. Available: https://trginternational.com/blog/concert-tourism-strategies/
- Envisio, “Swiftonomics and Local Governments: Having a Strategic Tourism Plan,” Nov. 30, 2023. [Online]. Available: https://envisio.com/blog/swiftonomics-local-governments-having-a-strategic-tourism-plan/
- D. Ingiss, “Tourism Marketing for Conferences: How Cities Attract Events and Boost Visitor Numbers,” Oct. 14, 2024. [Online]. Available: https://dangingiss.com/tourism-marketing/
- FasterCapital, “Multiplier Effect in Tourism: Vacation Economics,” Apr. 1, 2025. [Online]. Available: https://fastercapital.com/content/Multiplier-Effect-in-Tourism–Vacation-Economics–The-Multiplier-Effect-in-Tourism-Industry.html
- Mylighthouse, “The Taylor Swift Economy: The largest music tour in history is a hospitality phenomenon,” Aug. 3, 2023. [Online]. Available: https://www.mylighthouse.com/resources/blog/taylor-swift-impact-on-hospitality