Why Bitcoin Still Can’t Replace Your Bank Account
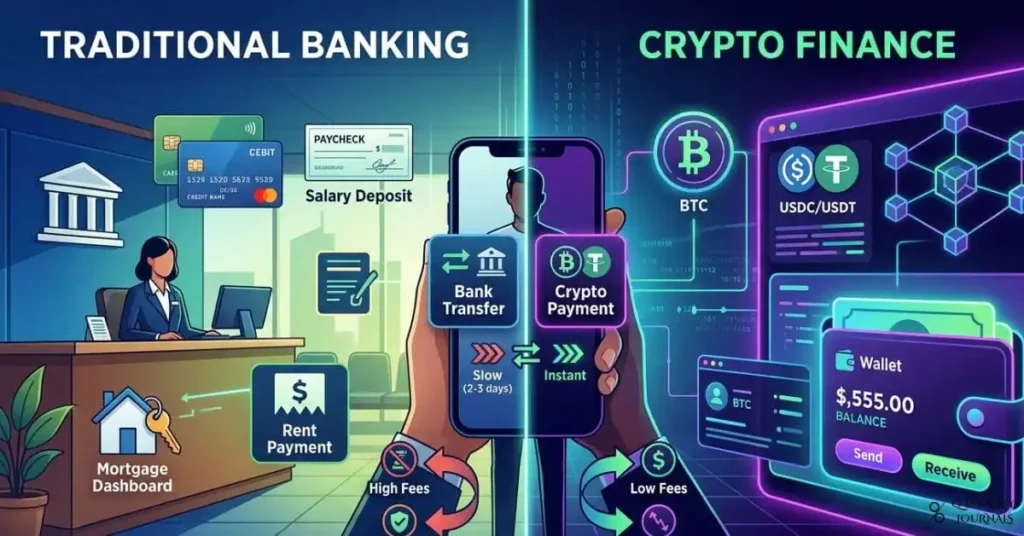
Crypto may have changed finance at the edges, but traditional banking still handles the core of everyday money: salaries, rent, taxes, loans, and most consumer payments. This guide compares crypto and traditional banking on the issues that matter most—volatility, trust, scale, regulation, speed, and usability—and shows why crypto supplements banks for most people rather than replacing them. It also explains where stablecoins, tokenized deposits, and cross-border payments are pushing the two systems closer together.
Why Bitcoin Still Can’t Replace Your Bank Account Read More »