Quirky Journal

A clean, modern illustration of a person standing at a crossroads with nine signposts labeled with money milestones such as “Budget,” “Emergency Fund,” “Debt Payoff,” “Invest,” and “Retirement.” In the background, a calm upward-trending financial dashboard and subtle icons for savings, housing, and goals appear on transparent screens. Bright but professional color palette with blues, greens, and soft gold accents, 16:9 aspect ratio, suitable as a blog header for an article about reaching financial goals and achieving total money clarity.

9 Steps to Financial Clarity and Better Money Goals

Most people want financial security, but few have a clear path to get there. This guide breaks the process into 9 practical steps that help you assess your current finances, set meaningful short-, mid-, and long-term goals, build a realistic budget, and create the momentum needed for lasting money clarity. Whether you are starting from scratch or resetting after a setback, these steps can help you turn vague intentions into a plan that actually works.

9 Steps to Financial Clarity and Better Money Goals Read More »

A clean, modern financial illustration showing a portfolio dashboard with red losing positions being selected and converted into tax credits, while green gains remain intact in the background. Include a calculator, IRS-style documents, and a subtle calendar icon highlighting the 30-day wash-sale window, with arrows showing losses offsetting gains. Professional editorial style with blue, green, and red accents, 16:9 aspect ratio, ideal as a blog header for an article on tax-loss harvesting and reducing tax liability legally.

Tax-Loss Harvesting: A Legal Way to Reduce Investment Taxes

Tax-loss harvesting turns paper losses into a real tax advantage by using losing positions to offset capital gains and, in some cases, reduce ordinary taxable income. This tutorial explains how the strategy works, why short-term and long-term gains matter, how the wash-sale rule can invalidate a trade, and how investors can use the process legally to lower annual tax liability without changing their overall portfolio goals.

Tax-Loss Harvesting: A Legal Way to Reduce Investment Taxes Read More »

A dramatic historical‑financial illustration showing a war‑torn cityscape in the background with tanks and planes, while in the foreground a giant stack of government bonds and numbered debt figures rises like a pyramid. In the sky, a timeline scrolls from 1700s conflict dates to modern years, with “$1.0% GDP”, “7% GDP”, and “Peak Debt” labels. Subtle red arrows point to inflation notes and bond‑yield charts, and a crowd of citizens looks up anxiously. Moody, cinematic style with desaturated colors and gold‑bronze debt accents, 16:9 aspect ratio, suitable as a blog header for an article on wartime government debt explosions.

War Economy Chapter 18: Government Debt Explosions

War almost always leads to an explosion in government debt because the cost of battle outpaces what taxes can cover, forcing states to borrow, print money, and push the financial burden onto future generations. This article traces wartime debt spikes from eighteenth‑century Britain to modern conflicts, explains how governments finance wars, and examines the long‑term effects on bond markets, inflation, and citizens’ living standards. It also shows why today’s already‑high public debt levels make new wars especially risky for advanced economies.

War Economy Chapter 18: Government Debt Explosions Read More »

A sleek, ultra-modern trading floor bathed in cool blue and electric green lighting, with towering curved monitors displaying cascading financial data, mathematical equations, and real-time stock charts. In the foreground, a glowing neural network diagram merges with stock market candlestick patterns. The atmosphere is high-tech and cinematic, evoking precision, machine intelligence, and Wall Street power. Style: photorealistic digital art, dramatic depth of field, dark background with neon data highlights. Aspect ratio: 16:9.

Quantitative Trading Explained: What Is a Quant Firm?

Most people have never heard of a quant firm — yet these math-driven organisations quietly influence the price of nearly every stock, bond, and currency on earth. This guide breaks down exactly what quant firms are, how systematic trading works, and why understanding them matters for anyone serious about modern financial markets.

Quantitative Trading Explained: What Is a Quant Firm? Read More »

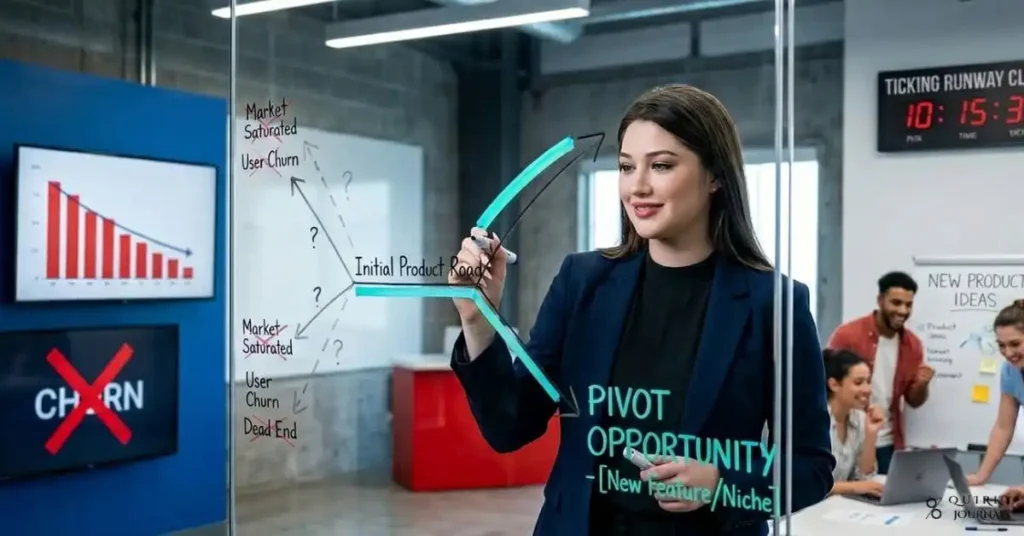
Managing Startup Finances Cash Flow, Burn Rate, and Runway

Startup Cash Flow, Burn Rate and Runway Explained

Most startups do not die from a lack of ideas—they die from a lack of cash. Understanding exactly how money moves through your business, how fast you are burning it, and how many months of runway you have left is what separates founders who can course-correct from those who hit the wall by surprise. This guide breaks down cash flow, burn rate, and runway in plain language, shows you how to calculate each with simple formulas, and outlines practical steps to extend your survival time without starving your growth.

Startup Cash Flow, Burn Rate and Runway Explained Read More »

A modern, editorial-style illustration of a smartphone showing a social media feed with a popular influencer post, while warning symbols, fake verification badges, and suspicious direct messages appear around the screen. In the foreground, a hand hesitates before clicking a “limited time investment” link, and subtle visual cues like a hacked account icon, a fake giveaway box, and a crypto wallet warning add tension. Bright social-media-inspired colors with sharp red caution accents, clean composition, 16:9 aspect ratio, suitable as a blog header for an article about influencer scams and online money protection.

9 Influencer Scams to Avoid: How to Protect Your Money Online

Influencer scams thrive on trust, urgency, and the illusion of insider access, which makes them dangerously effective across social media platforms. This guide breaks down 9 common influencer scams, shows you the red flags behind each one, and explains how to protect your money, your identity, and your online reputation before a bad deal turns into a costly mistake.

9 Influencer Scams to Avoid: How to Protect Your Money Online Read More »

A clean, data‑driven illustration showing two parallel paths rising over time, labeled “ETF” and “Mutual Fund,” with small fee percentages (e.g., 0.05% vs 0.60%) at the base and the final wealth values at the end of the line significantly diverging, emphasizing compounding. Overlay icons for stock indices, expense‑ratio percentages, and subtle tax‑efficiency symbols, with a muted background of market charts and fund shares. Professional, modern design with blue and green tones, 16:9 aspect ratio, ideal as a blog header for an article on ETF vs. mutual fund expense ratios and long‑term growth.

ETF vs. Mutual Fund: Minimising Fees for Maximum Growth

ETFs and mutual funds can both track the same index, but the ETF vs. mutual fund duel turns into a long‑term wealth fight where the quieter winner is usually the one with the lower expense ratio. This guide compares the fee structures, tax efficiency, and compounding effects of ETFs and mutual funds so you can see how small differences in costs add up to tens or even hundreds of thousands of dollars over decades.

ETF vs. Mutual Fund: Minimising Fees for Maximum Growth Read More »

A dramatic editorial-style scene of a wartime economy marketplace with empty shelves, ration cards, and price tags being rapidly rewritten upward. In the background, factories switch from consumer goods to military production, while a government notice board displays “Price Controls” and “Rationing.” A faint rising inflation chart overlays the scene, and distressed shoppers contrast with a military convoy passing in the distance. Moody, realistic lighting with desaturated colors and red highlights, 16:9 aspect ratio, suitable as a blog header for an article on wartime inflation, hyperinflation, and price controls.

War Economy Chapter 17: Inflation, Hyperinflation, and Wartime Price Controls

War does not just destroy cities and supply chains; it also breaks the price system. As governments fund conflict through borrowing and money creation, inflation rises, supplies shrink, and price controls often follow, sometimes preventing panic and sometimes creating shortages and black markets. This article explains why wartime inflation turns into hyperinflation in extreme cases, how demand-pull and cost-push forces interact, and what historical episodes teach us about managing prices during war.

War Economy Chapter 17: Inflation, Hyperinflation, and Wartime Price Controls Read More »